Java Performance Optimization
Java Performance Optimization
Last night I decided to revive my poker hand evaluator library and look at it from a performance perspective and do some optimizations if need be. Some of my findings give insight into what kinds of things are optimized in JDK 1.6 vs JDK 1.5 and how things vary between Mac OS X, Windows, and Linux.
So the first stage of any optimization project is to create benchmarks that accurately reflect the usage of the system in the real world — with some nod to the worst case scenario. The two benchmarks I produced to test the poker library were the following:
1) Run an entire 10 hand Texas Hold’em poker game from beginning to end with no one folding and determine a winner. This should reflect the worst case scenario for a poker server that is trying to serve games to users.
2) Evaluate random hands with random boards. This should reflect what would be required to do Monte Carlo simulations or full solution space searches.
The benchmarks will be reported on three different systems:
A) MacPro, Mac OS X 10.4.9, 2x Intel Xeon 5160 (dual core 3 ghz), 8G RAM, JDK 1.5.0_07
B) MacPro, Windows XP SP2, 2x Intel Xeon 5160 (dual core 3 ghz), 8G RAM, JDK 1.5.0_11 + JDK 1.6.0 + JRockit 5.0 R27.2
B) Dell 1850, 2x Intel Xeon 2.8 ghz (1st gen dual core, hyperthreading enabled), 4G RAM, JDK 1.5.0_11, JDK 1.6.0
If you run the benchmark on another system, please send me the results or post them in the comments. The second thing that I did was go and get a profiler. I tried a bunch of different profilers but the one that has the best integration with my IDE and also performs quite well was JProfiler 4.0 (integrated with IntelliJ IDEA). The one that was the cheapest (free) and most barebones that worked was JIP-1.0.7 and I also think it was more accurate for methods that get inlined at runtime but they basically showed identical results. JIP though is $499 cheaper and doesn’t have a nice runtime graphical display of the progress. Another advantage of JIP was that programs execute about twice as fast as under JProfiler. Looks like they need an IntelliJ IDEA plugin :)
The starting point for the poker engine was written using the Java collection classes and leveraged them quite a bit to make things clean and easy to understand. I knew at the time though that there were probably many optimizations that could be done either with custom collections or by using arrays when appropriate. So our base benchmarks look like this (best of 3):
[ java -jar bench.jar 1] bench-3687.jar
EnvironmentThreadsGames / secondRanks / second Mac OS X, 1.5 client VM111093130975
So what do the profiles show? It turns out that using the collections libraries, even those without concurrency and carefully choosing implementations, you still end up spending tons of time within them rather than doing the real work of your program. Especially for something as data intensive as this application. I spent a couple hours painstakingly moving the collections usage over to arrays in all the hotspots that I found in the code. One consequence of this is that I found a few bugs and added a few new tests to the system so it was a very useful exercise even separate from the performance optimizations. Making these changes — without changing the interface to the library which was quite simple — netted us quite a profit:
[ java -jar bench.jar 1] bench-3785.jar
EnvironmentThreadsGames / secondRanks / second Mac OS X, 1.5 client VM126525389610
You’ll notice that we are executing these benchmarks with the absolute default as far as tuning the Java VM goes. It turns out that tuning the VM is absolutely critical with Sun’s VM if you want the best performance — and it isn’t a small difference either. As it turns out it is very easy to get into pathological GC conditions where you are very close to the memory limit where it doesn’t not increase the heap size but instead drastically increases the frequency of collections causing the performance of the benchmark to plummet. I have even seen conditions where it is nearly at a standstill. For this benchmark we find increasing the minimum heap size well above this GC pathology threshold helps tremendously, as does using the server VM so he following benchmarks use:
[ java -server -Xmx256m -Xms256m -jar bench 1/2/4]
EnvironmentThreadsGames / secondRanks / second Mac OS X, 1.5 server VM152714696055 Mac OS X, 1.5 server VM2907531264974 Mac OS X, 1.5 server VM41200542238467
I’ve also done these benchmarks on a full suite of systems. Unfortunately, I’m not at liberty to say which VM performed the best (the aqua line) due to an NDA I’ve signed with a large computer company but as you can see, there is widely varying behavior from the various JVMs:
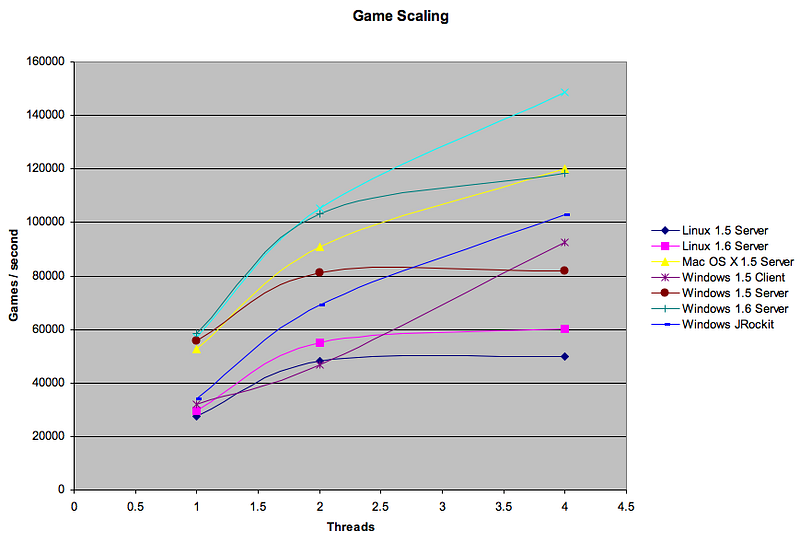
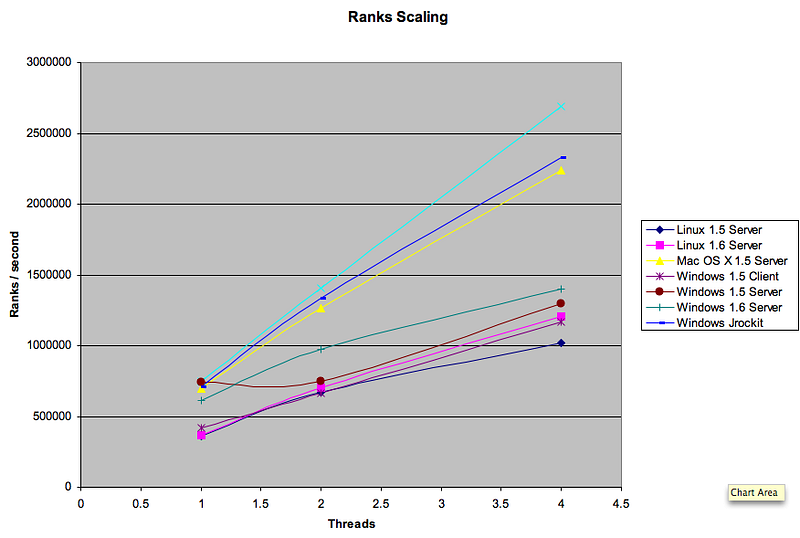
As it turns out, the current set of Java VMs still cannot completely self-tune themselves, especially when it comes to choosing the amount of memory they should allocate for the best performance. Certainly more innovation around self-tuning has been done in the 1.6 and JRockit VMs but I believe, based on my limited results, that there is still a lot of room for improvement. The other take away is that the newer processors, even with approximately the same clock rate, have much better performance characteristics and scale far better than their predecessors. Finally, it appears that Mac OS X crushes Windows for running Java applications on the same hardware, especially when running heavily multithreaded applications. Of course, as with any benchmark, this is only applicable for applications quite similar to the poker engine. Other application behavior may vary as the different strengths of the systems are exercised.
Here is the current version of the Poker Engine under an attribution, non-commercial use creative commons license:
PokerEngine.zip